Project 2: Graphical representation
All graphs were drawn using Excel's graphing function, two forcefields have been omitted from the graphical representation.
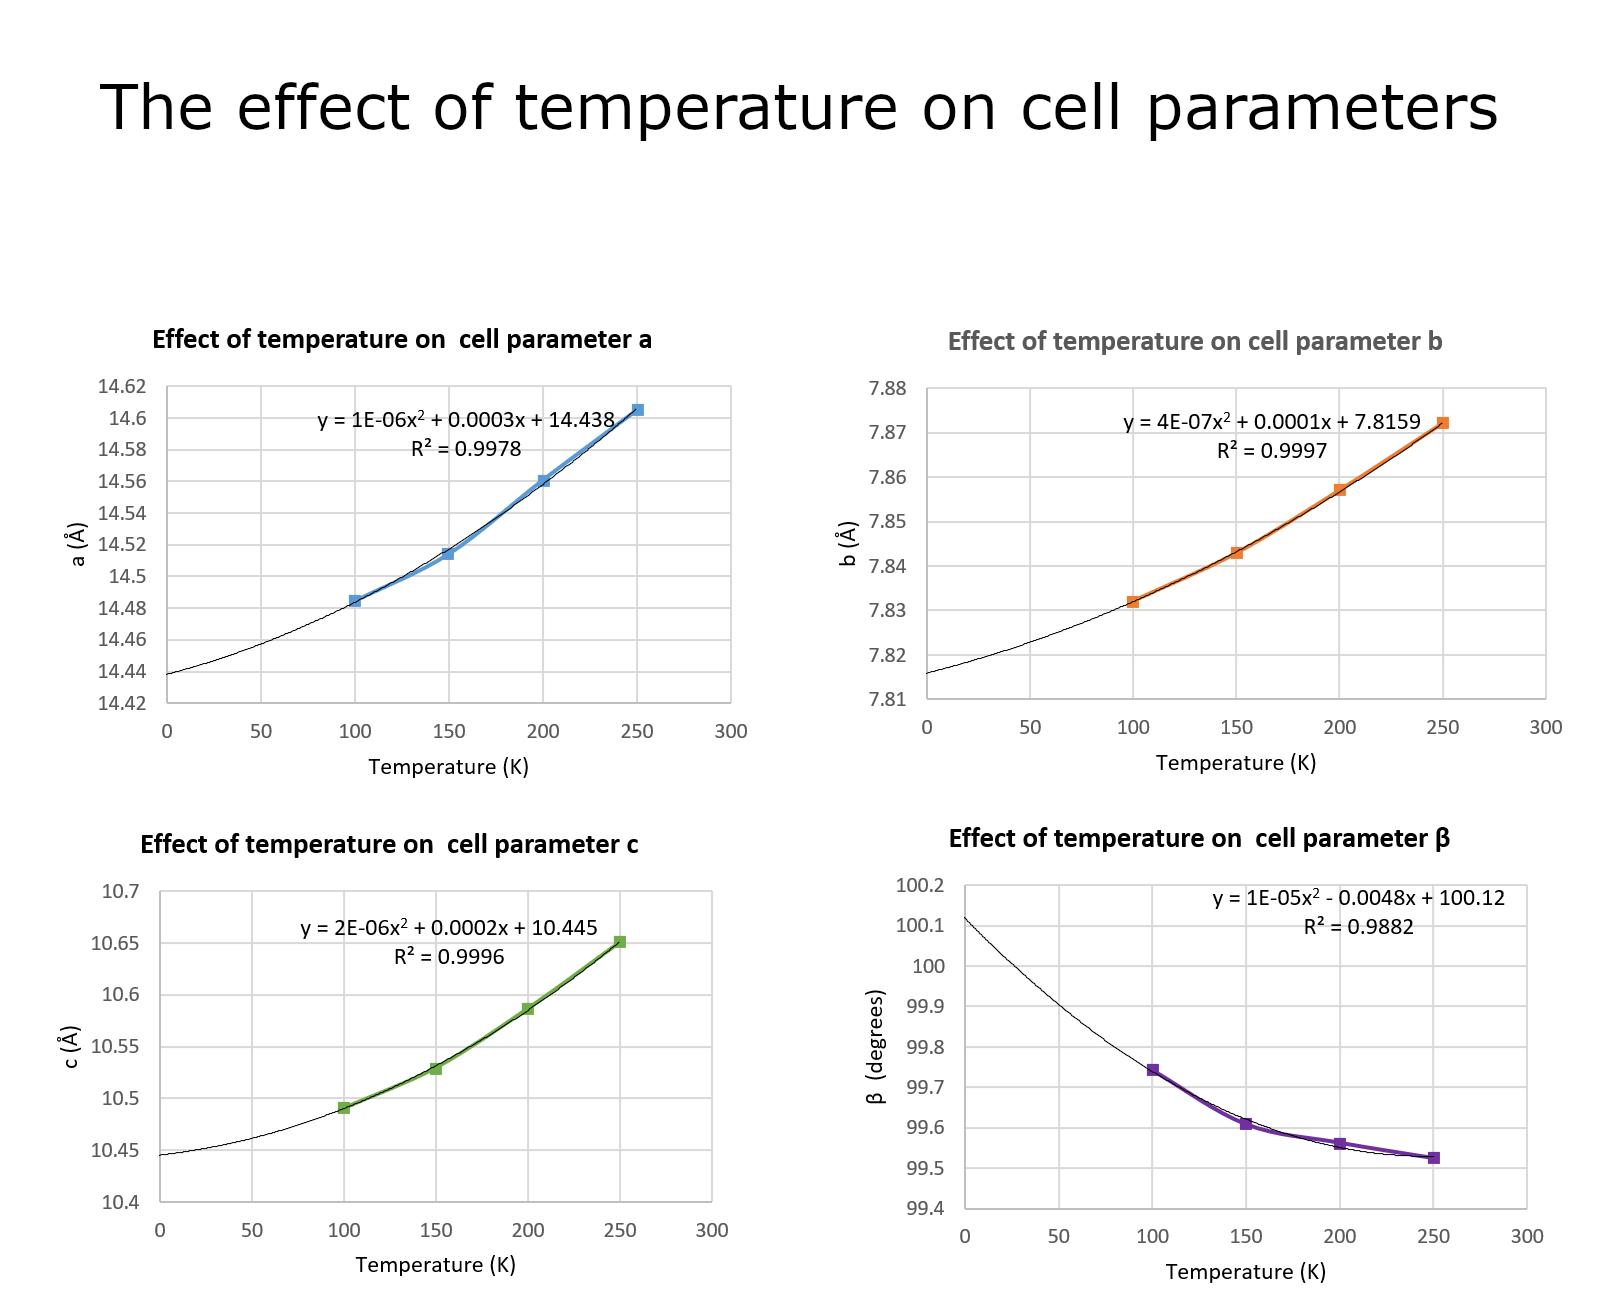
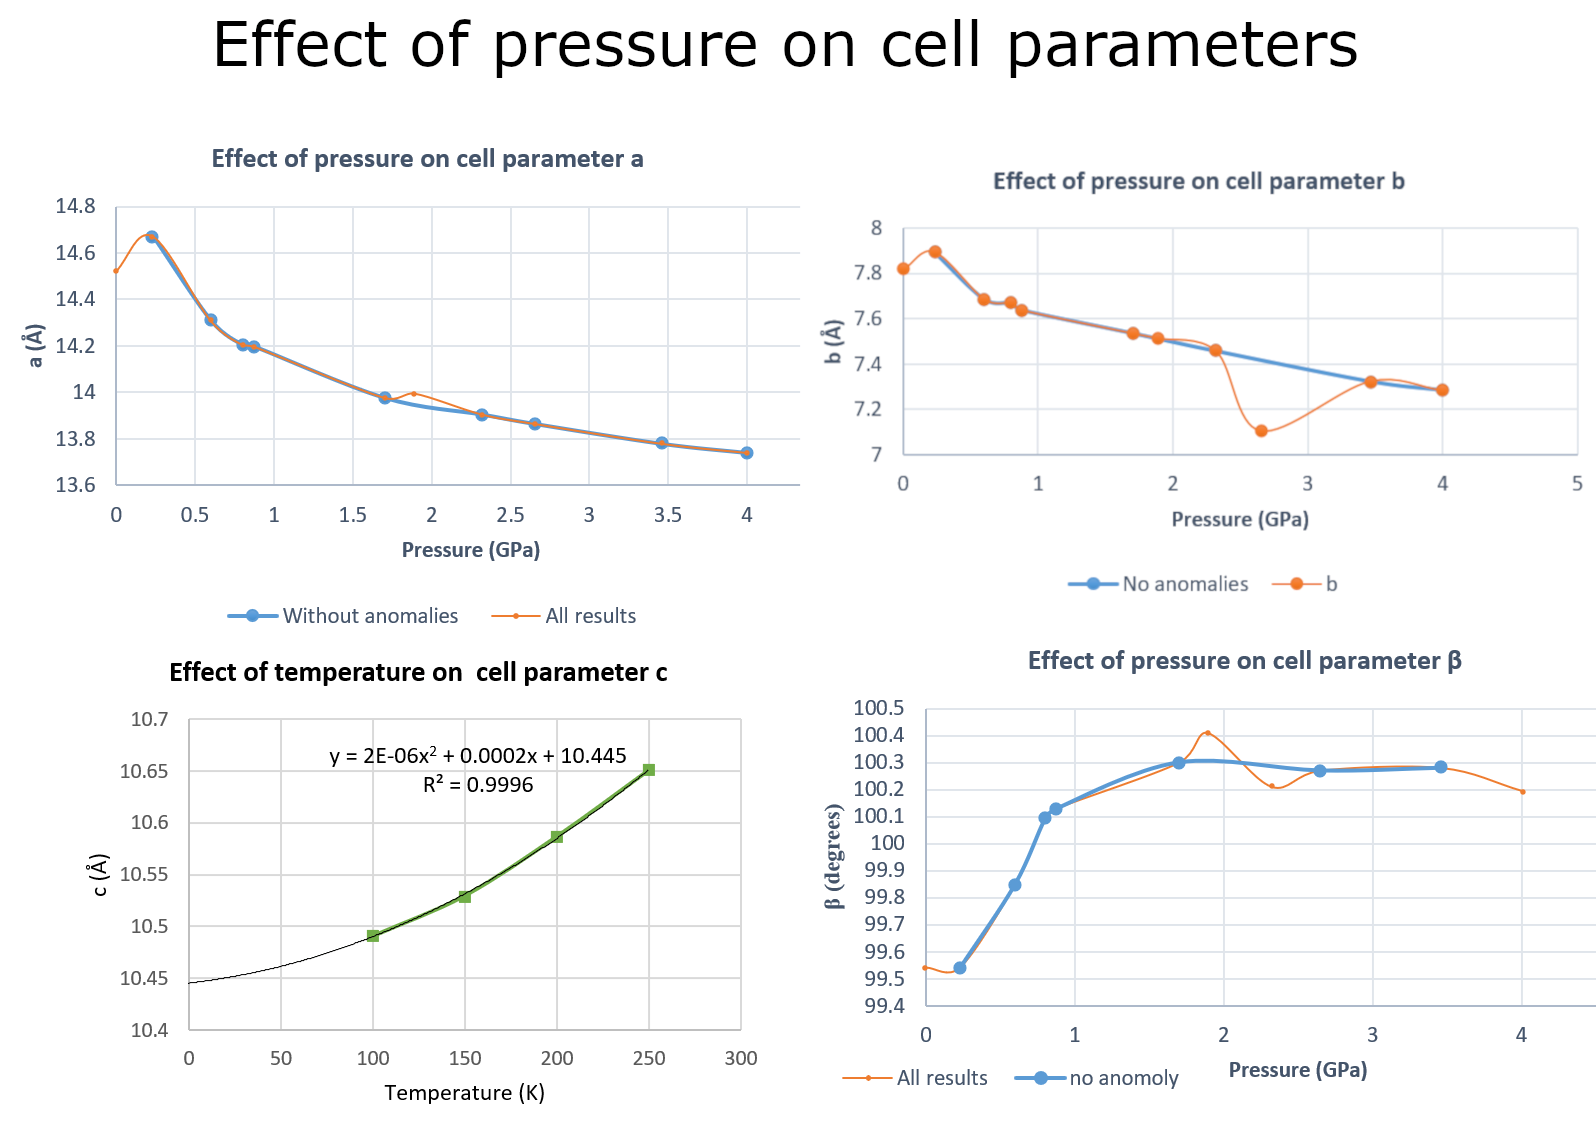
The graphs below show the changes in the cell parameter with both temperature and pressure.
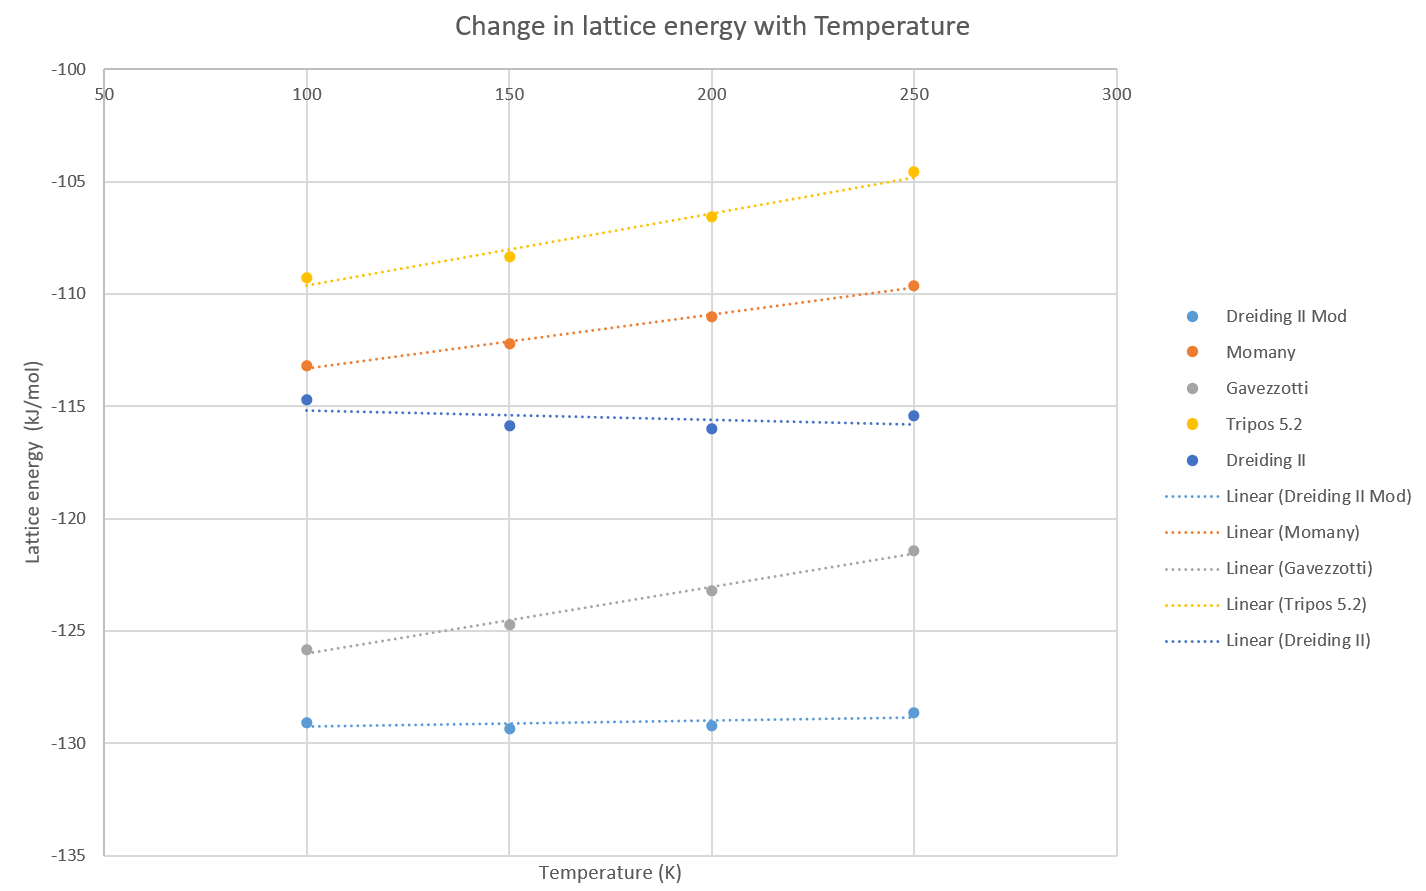
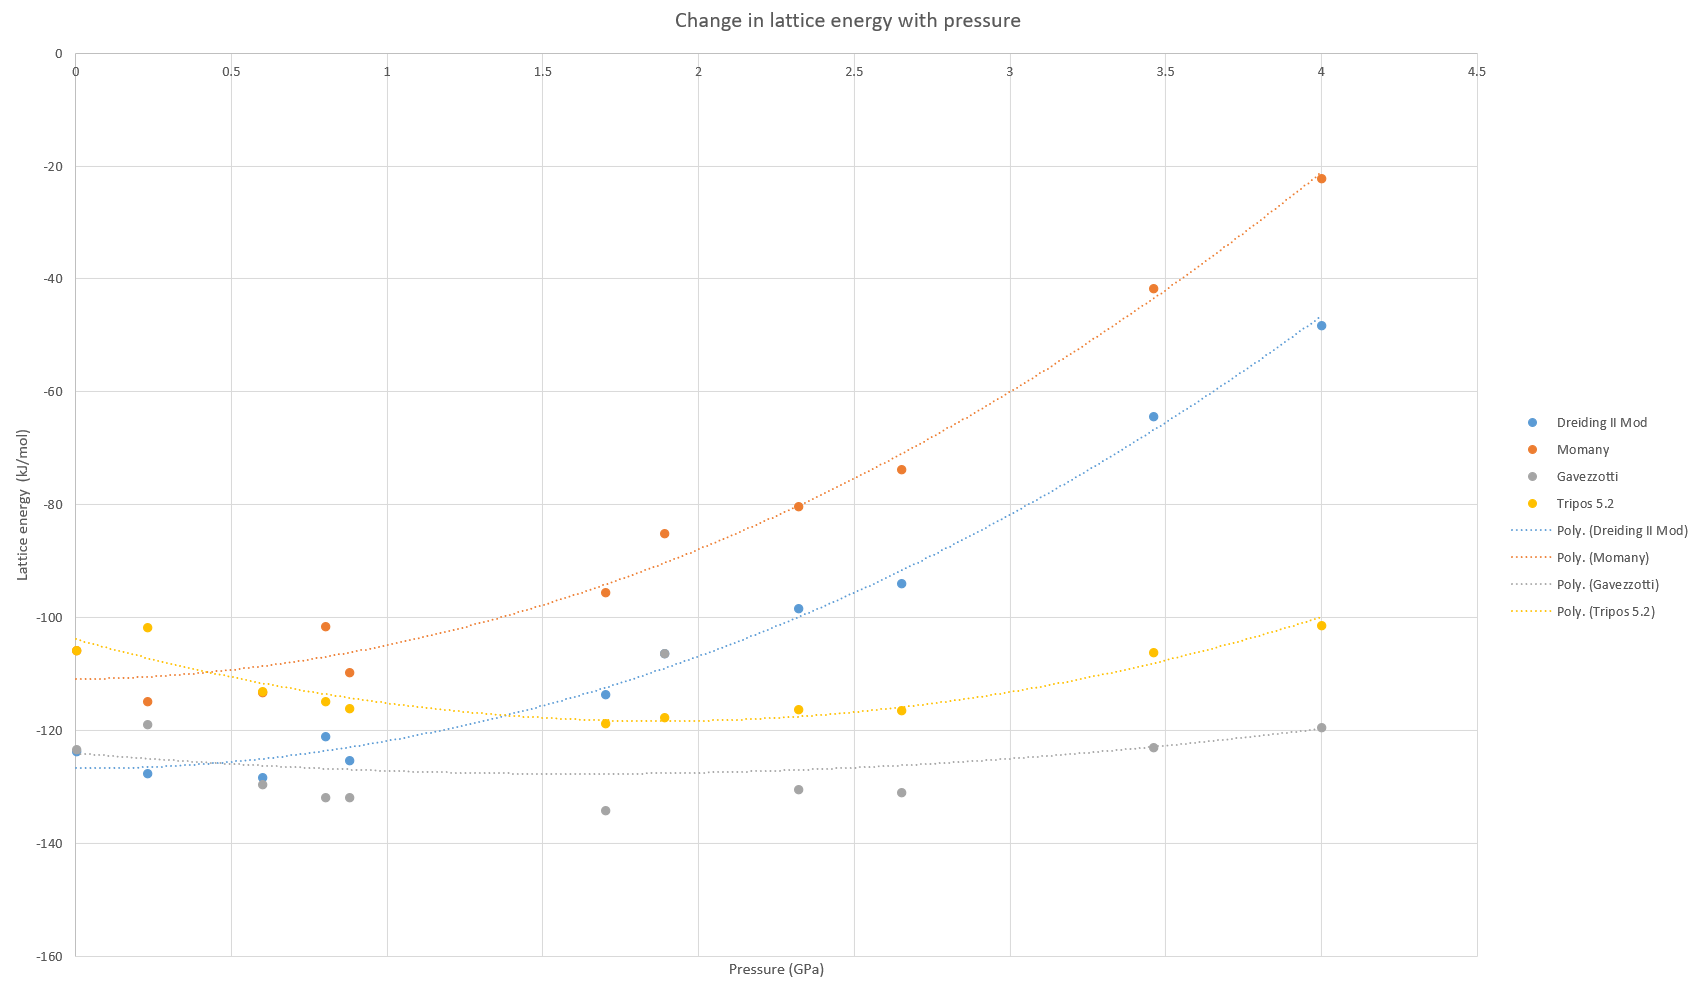
These graphs show the change the lattice energy with both temperature and pressure.